

We set out to do a better job of summarizing activities tracked by RunKeeper users: simply recounting stuff like distance completed, calories burned, and other performance metrics has long seemed a bit clinical, lacking in feeling.
What if we could automatically generate a lil GIF documentary of a person's run or bike ride from a combination of [1] Google Streetview timelapses and [2] various animations triggered by weather, performance, and other activity-specific events? A discrete, shareable unit unique to each activity.

We put together a quick experience prototype to illustrate the concept [see below] and set forth on a number of technical prototypes as well after deciding "Yes, this could be decently cool."


The timelapse looked like the hard part, so we decided to focus on that first. Fortunately, other people had previously done similar work! Thank heavens.
We married RunKeeper GPS traces with Teehan + Lax's fantastic Hyperlapse tool (along with its various dependencies) to render timelapse summaries of those activities in the browser. Server-side, we used PhantomJS to slice up each timelapse into frames and put them back together as GIFs with ImageMagick. A few resulting GIF summaries included below.

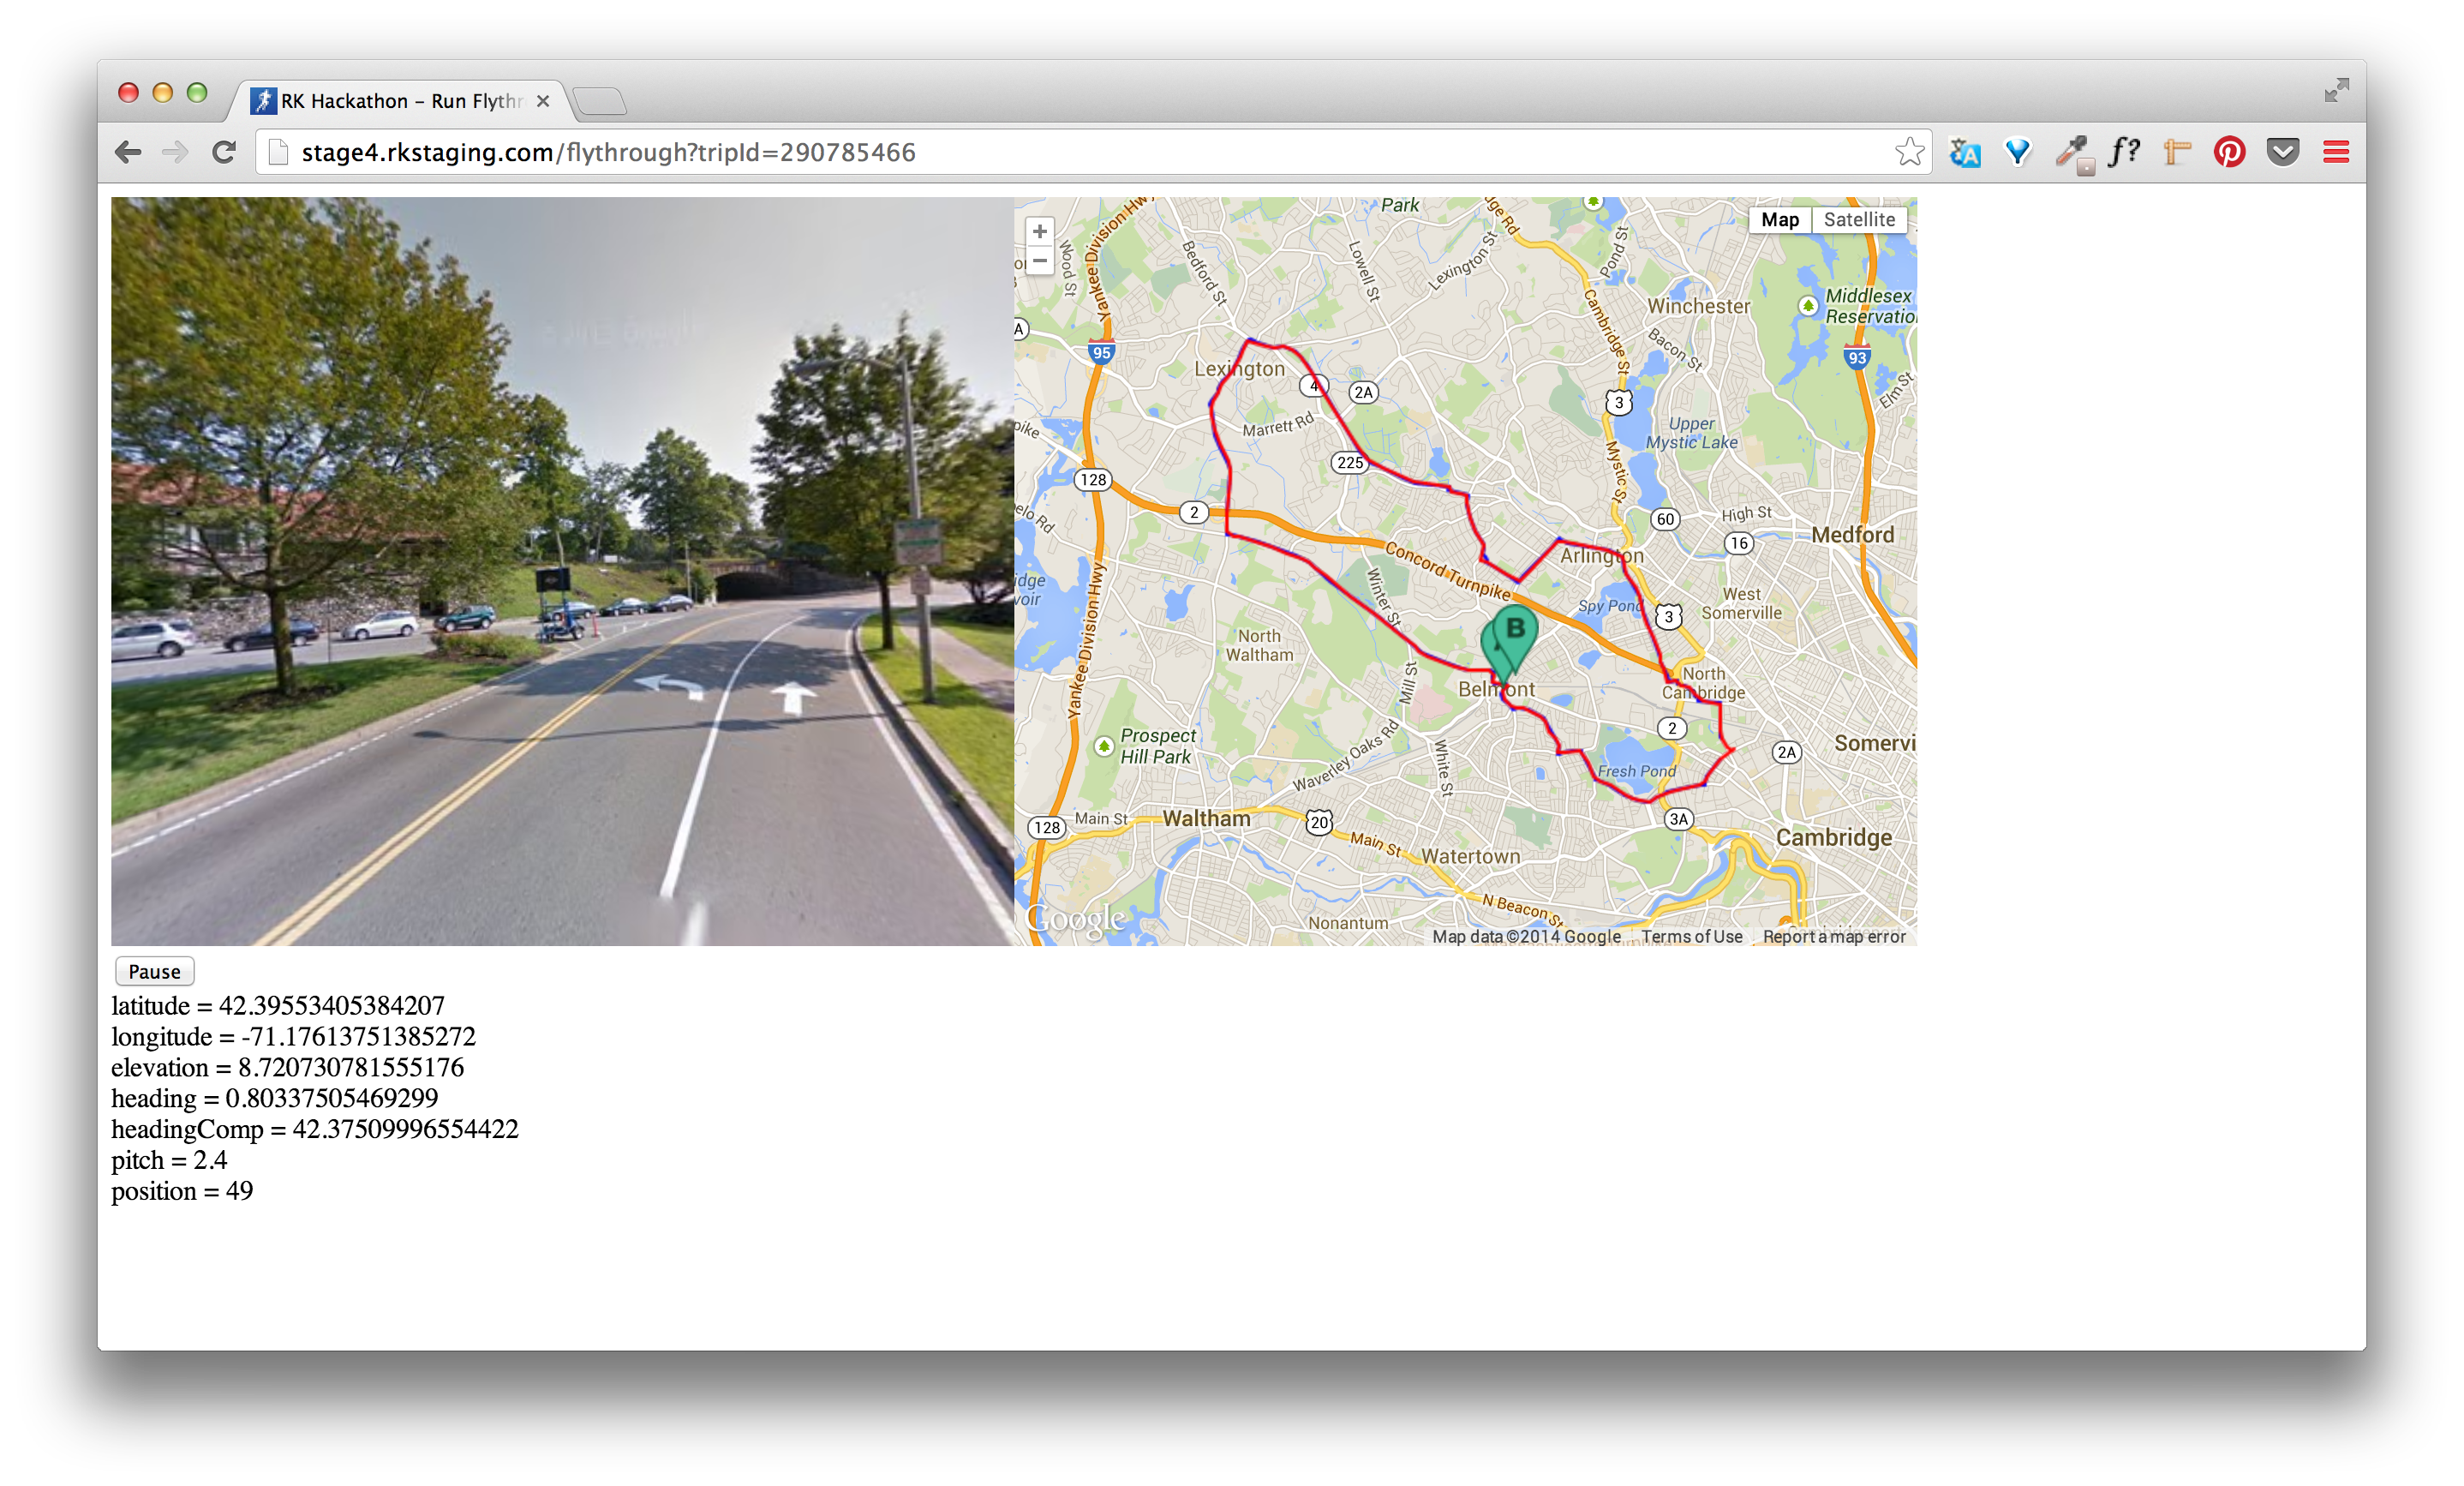
Once we'd gotten the timelapse-to-GIF conversion part right, we moved on to linking up activity-specific events to the timelapse. We created a display [see below] that shows some of the metrics we track and a map alongside the timelapse to help us identify interesting triggers.

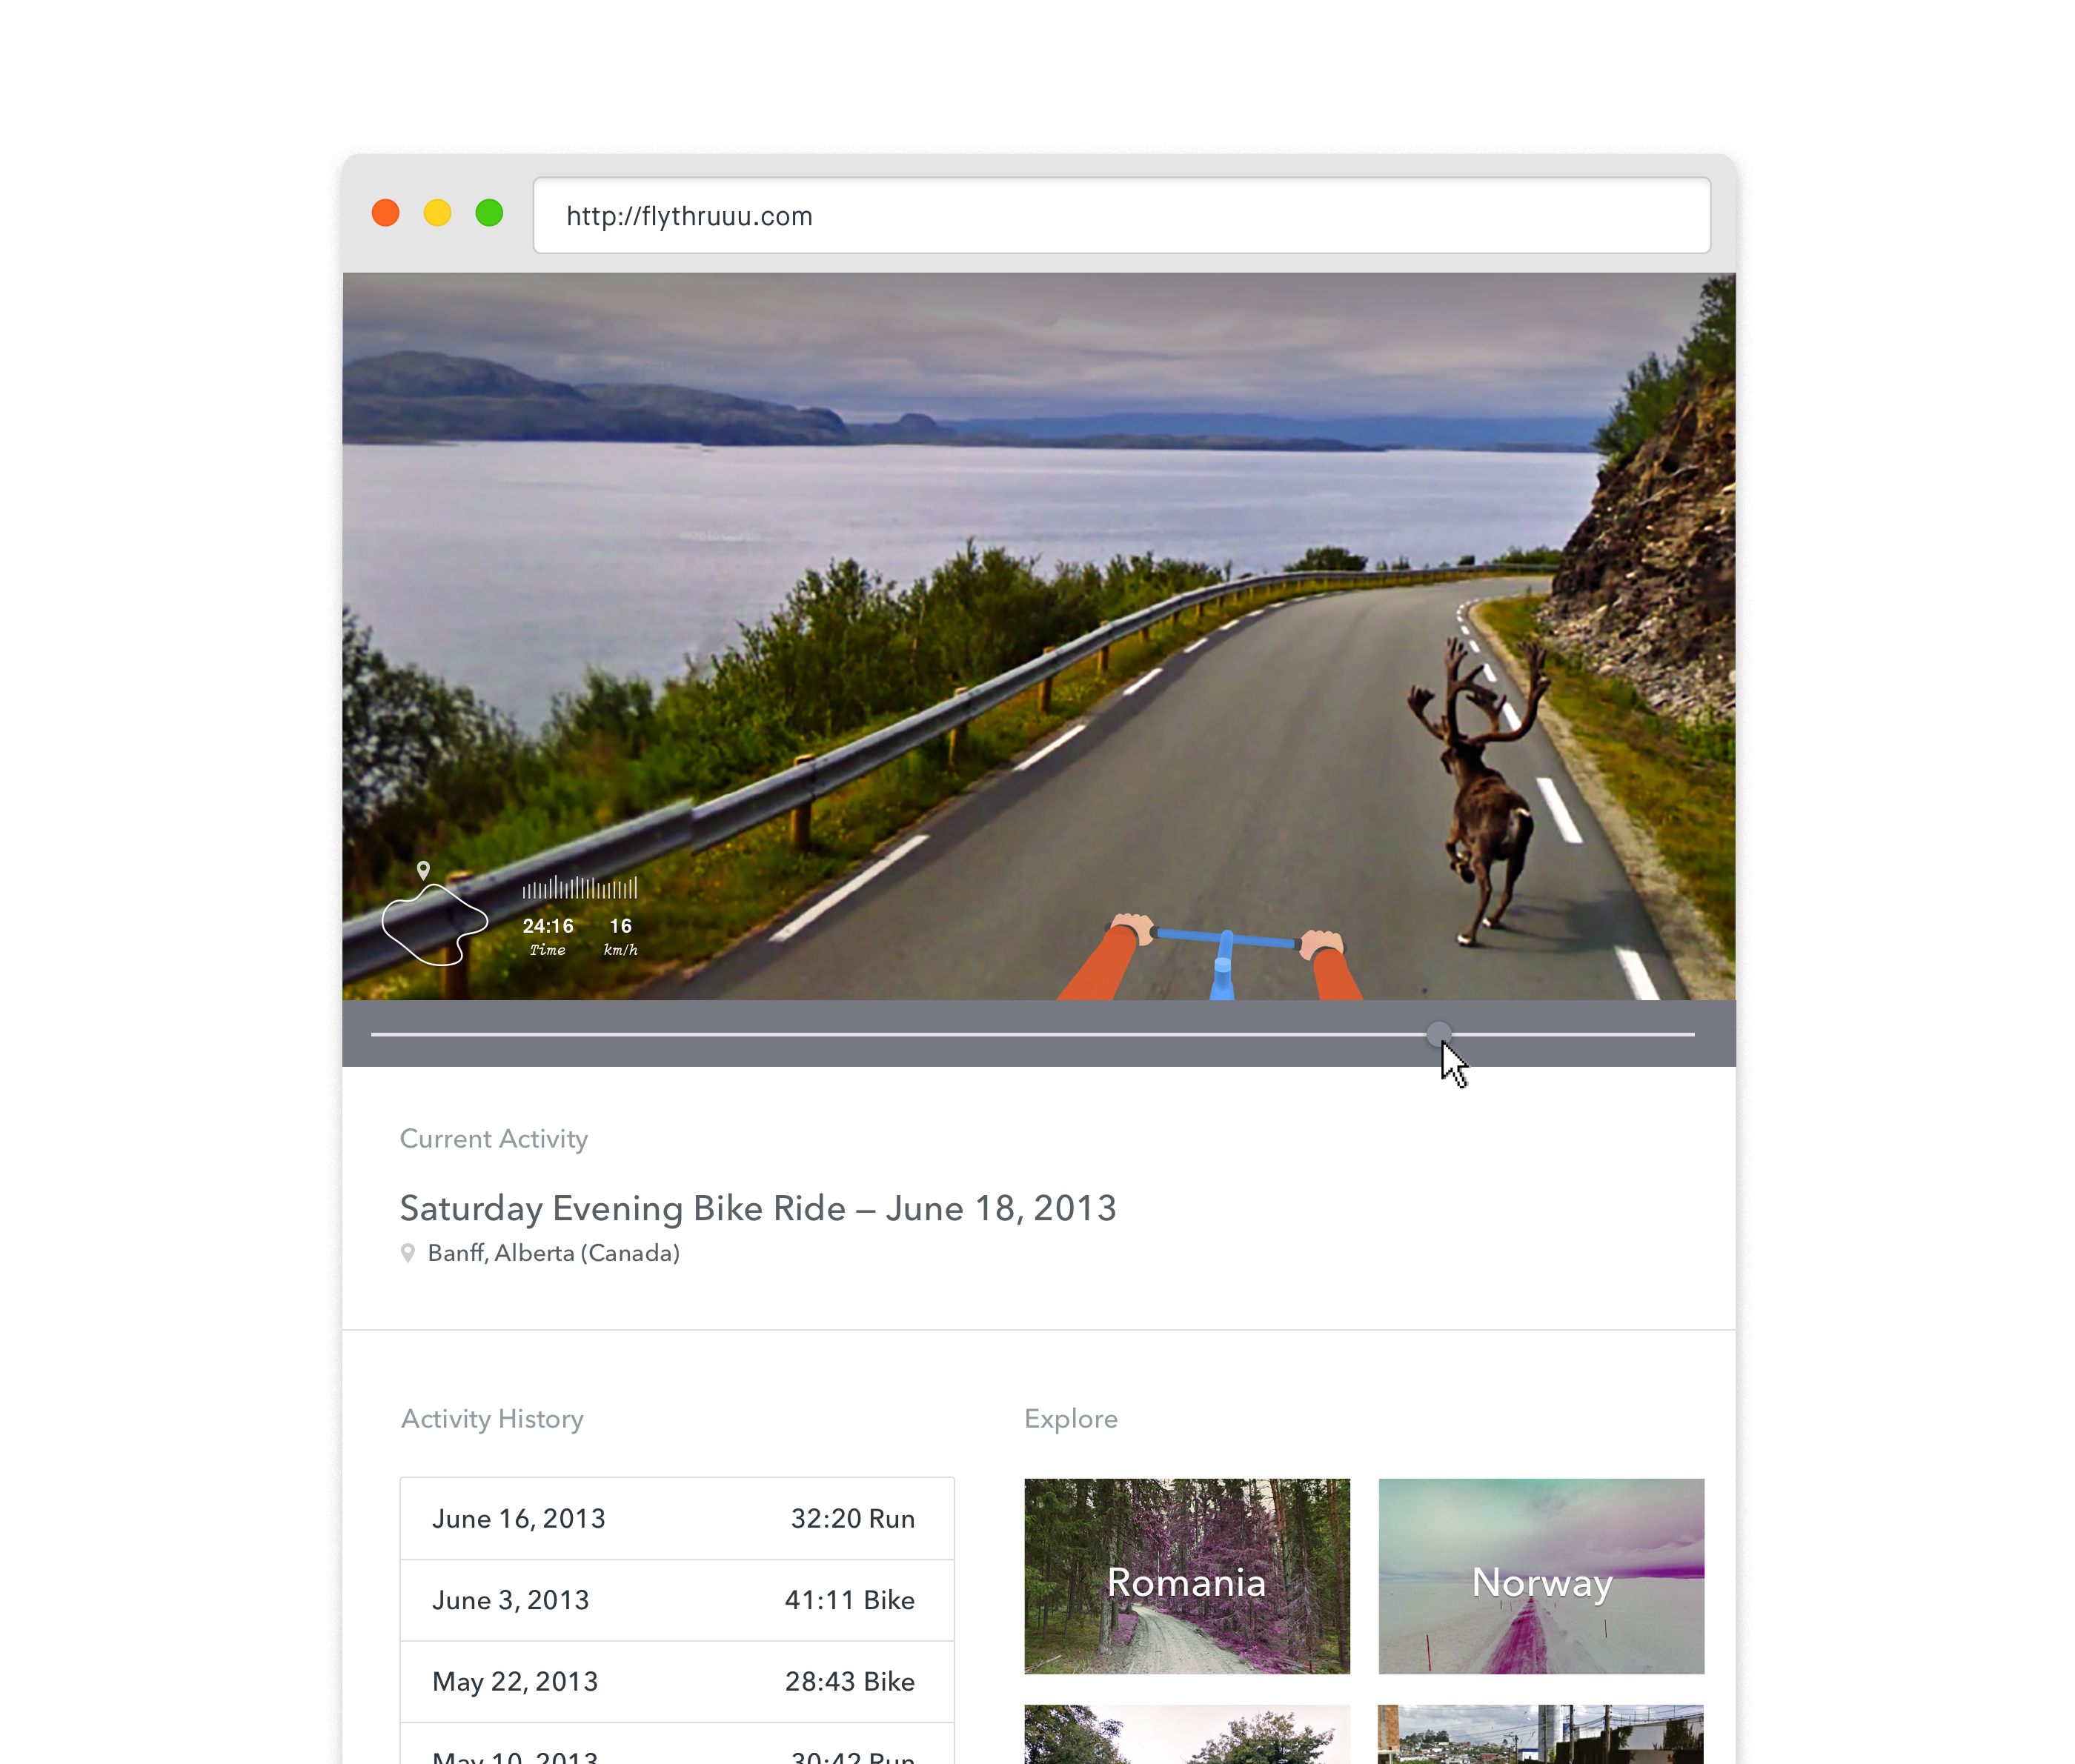
With the above proof-of-concepts worked out, we've moved on to figuring out what initial implementation of Flythru might look like. Before jumping right into an in-app experience optimized for easy sharing, we propose a web experience that would allow users to create Flythrus of their own activities and explore publicly available Flythrus of activities tracked by others from around the world [see below].
That's all.
☮